All the articles with the tag "Shiny".
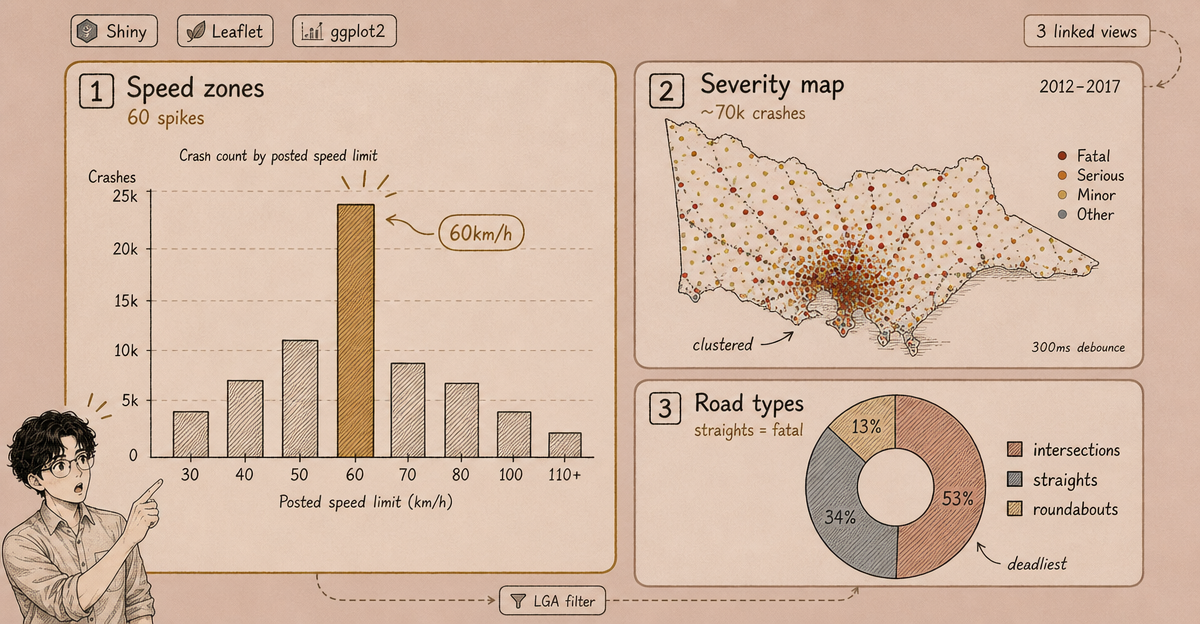
An interactive R Shiny dashboard exploring five years of VicRoads crash data, featuring speed-zone analysis, severity mapping, and road-type breakdowns.
Pull up a chair — ask me anything.